How Our Energy Problem Leads to a Debt Collapse Problem
Gail Tverberg er aktuar, hennes profesjon består i å analysere konkursrisiko av bedrifter for forsikringsbransjen. Hennes konklusjon er at bedriften Jorden går konkurs i nær framtid. Da hele vår sivilisasjon er å regne som en eneste stor bedrift, hva økofilosofen Sigmund Setreng kaller AKIS, "avanserte konkurranse-industrielle system", betyr dette at vi mister vårt system. Ingen arbeider seriøst med å få på beina et nytt system.
Originalt innlegg her.
Usually, we don’t stop to think about how the whole economy works together. A major reason is that we have been lacking data to see long-term relationships. In this post, I show some longer-term time series relating to energy growth, GDP growth, and debt growth–going back to 1820 in some cases–that help us understand our situation better.

Originalt innlegg her.
How our energy problem leads to a debt collapse problem
Usually, we don’t stop to think about how the whole economy works together. A major reason is that we have been lacking data to see long-term relationships. In this post, I show some longer-term time series relating to energy growth, GDP growth, and debt growth–going back to 1820 in some cases–that help us understand our situation better.
When examining these long-term time series, I come to the conclusion that what we are doing now is building debt to unsustainably high levels, thanks to today’s high cost of producing energy products. I doubt that this can be turned around. To do so would require immediate production of huge quantities of incredibly cheap energy products–that is oil at less than $20 per barrel in 2014$, and other energy products with comparably low cost structures.
Our goal would need to be to get back to the energy cost levels that we had prior to the run-up in costs in the 1970s. Growth in energy use would probably need to rise back to pre-1975 levels as well. Of course, such a low-price, high-growth scenario isn’t really sustainable in a finite world either. It would have adverse follow-on effects, too, including climate change.
In this post, I explain the reasoning that leads to this conclusion. Some back-up information is provided in the Appendix as well.
Insight 1. Economic growth tends to take place when a civilization can make goods and services more cheaply–that is, with less human labor, and often with smaller quantities of resources of other kinds as well.
When an economy learns how to make goods more cheaply, the group of people in that economy can make more goods and services in total because, on average, each worker can make more goods and services in his available work-time. We might say that members of that economy are becoming more productive. This additional productivity can be distributed among workers, supervisors, governments, and businesses, allowing what we think of as economic growth.
Insight 2. The way that increased productivity usually takes place is throughleveraging of human labor with supplemental energy from other sources.
The reason why we would expect supplemental energy to be important is because the amount of energy an individual worker can provide is not very great without access to supplemental energy. Analysis shows that human mechanical power amounts to about 100 watts over a typical laboring day–about equal to the energy of a 100-watt light bulb.
Human energy can be leveraged with other energy in many other forms–the burning of wood (for example, for cooking); the use of animals such as dogs, oxen, and horses to supplement our human labor; the harnessing of water or wind energy; the burning of fossil fuels and the use of nuclear energy. The addition of increasingly large amounts of energy products tends to lead to greater productivity, and thus, greater economic growth.
As an example of one kind of leveraging, consider the use of oil for delivering goods in trucks. A business might still be able to deliver goods without this use of oil. In this case, the business might hire an employee to walk to the delivery location and carry the goods to be delivered in his hands.
A big change occurs when oil and other modern fuels become available. It is possible to manufacture trucks to deliver goods. (In fact, modern fuels are needed to make the metals used in building the truck.) Modern fuels also make it possible to build the roads on which the truck operates. Finally, oil products are used to operate the truck.
With the use of a truck, the worker can deliver goods more quickly, since he no longer has to walk to his delivery locations. Thus, the worker can deliver far more goods in a normal work-day. This is the way his productivity increases.
Insight 3. Growth in GDP has generally been less than 1.0% more than the growth in energy consumption. The only periods when this was not true were the periods 1975-1985 and 1985-1995.
This is an exhibit I prepared using data from the sources listed.
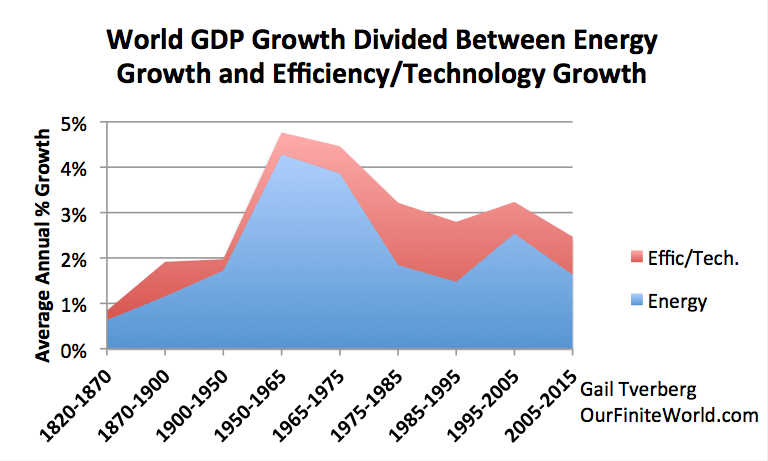
Figure 1. World GDP growth compared to world energy consumption growth for selected time periods since 1820. World real GDP trends for 1975 to present are based on USDA real GDP data in 2010$ for 1975 and subsequent. (Estimated by author for 2015.) GDP estimates for prior to 1975 are based on Maddison project updates as of 2013. Growth in the use of energy products is based on a combination of data from Appendix A data from Vaclav Smil’sEnergy Transitions: History, Requirements and Prospects together with BP Statistical Review of World Energy 2015 for 1965 and subsequent.
The difference between energy growth and GDP growth is attributed to Efficiency and Technology. In fact, energy use and technology use work hand in hand. People don’t buy oil just to have oil; they buy oil for the services that devices using oil can provide. Efficiency is important too. If a device is cheaper to use, thanks to efficient use of energy, consumers find it more affordable (if the cost of the device itself is not too expensive). Thus, efficiency can lead to more use of energy.
The period between 1975 and 1985 was the period when the developed economies were making many changes including
- Changes to make automobiles smaller and more fuel efficient
- Replacement of oil-fired electricity generation with nuclear (which needed no fossil fuels for ongoing fuel) and with coal
- Replacement of home heating using oil with more modern heating units, not using oil
Some of this effort continued into the 1985-1995 period, as newer cars gradually replaced older cars, and modern furnaces gradually replaced oil-fired furnaces. Thus, we should not be surprised that the 1975-1985 and 1985-1995 periods were the ones with unusually high growth in Efficiency/Technology.
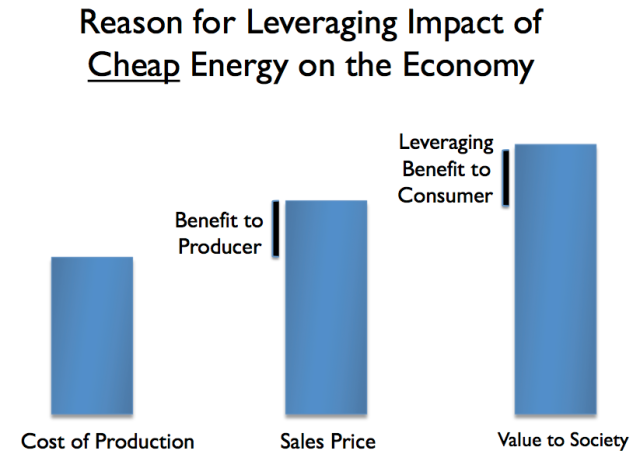
Insight 4. The value of energy to society is not the same as the cost of extracting it, refining it, and shipping it to the desired end location.
The value of energy to society reflects the additional goods and services that we as a society can produce, thanks to the benefits energy adds to the system as a whole. This value can be either higher or lower than the cost of extracting the energy from the ground, processing it, and delivering it so that it will work in our devices.
If the price of oil, or of other energy products, is low, we would expect the cost of production to be lower than its value to society. We can visualize the relationship to be as shown in Figure 2. It is the low price that provides the leveraging benefit of oil.

Figure 2. Illustration by author.
In the example given in Insight 2 of the worker driving a truck over a road to deliver goods, there are actually many “players” involved:
- The company extracting the oil
- The government of the company extracting the oil
- The business making the truck
- The government of the country building the road
- The business hiring the worker delivering the goods
- The worker himself
The benefit of the efficiency gain is shared among the different players listed above. How this sharing is done is based on relative price levels and government tax levels. Thus, there are many different types of entities (which I refer to on Figure 2 as “consumers”) all getting a benefit from the leveraging impact of the oil products at the same time.
The value to society of oil and of other energy products is pretty much fixed, based on the energy content (in Btus or whatever other unit a person desires). The value to society can change a little with energy efficiency, if we learn to pave roads with less use of energy products, and if we learn to manufacture trucks with less use of energy products, and if we can make the trucks that use it become more efficient per mile.
If the cost of producing oil or other energy product rises (in other words, the left bar in Figure 2 gets taller), then the “gap” between the cost of production and the value to society (right bar) may fall too low. The amount of money to distribute, resulting from the gain that comes from using energy to leverage human labor, falls. None of the entities involved can get an adequate distribution: There is less money to pay interest payments on debt; there is less money to pay dividend payments to stockholders; there is less money to give the workers raises. In fact, it reminds me of the situation described in my post Why We Have an Oversupply of Almost Everything (Oil, labor, capital, etc.)
If there is too little gap between the selling price of oil and its value to society, there gets to be pressure for the price of oil to fall. Partly, this comes from low wage increases (because wages are being squeezed). If workers cannot buy finished products such as homes and cars, the price of commodities such as steel and oil tends to drop. This seems to be the situation today. Partly this pressure come from the fact that society can live for a while with “squeezed margins. Eventually, some of the “pain” needs to go back to the oil producers (the difference between the left bar and the middle bar on Figure 2), instead of only being borne by the oil consumers (the difference between the middle bar and the right bar on Figure 2). This is why we should expect the kind of oil price drop experienced in the past year.
Insight 5. We would expect world economic growth to slow as oil prices rise, because of Insights (1) and (2).
According to (1), we need to make goods increasingly cheaply to support economic growth. Oil is the energy product with the highest use worldwide. If its cost rises, it takes a huge amount of savings elsewhere in the system to allow the combination to continue to produce goods increasingly cheaply.
According to (2), it is the energy content that needs to rise. With higher prices, consumers can afford less. As a result, they tend to consume less, in energy content. This lower energy consumption lowers the leveraging of human energy, so there tends to be less economic growth.
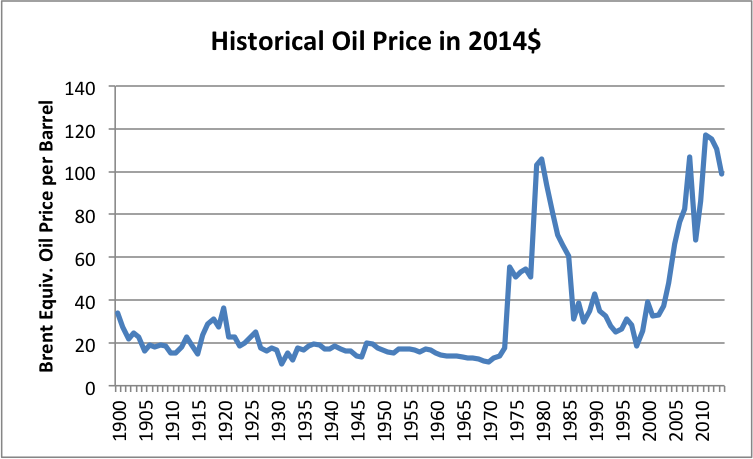
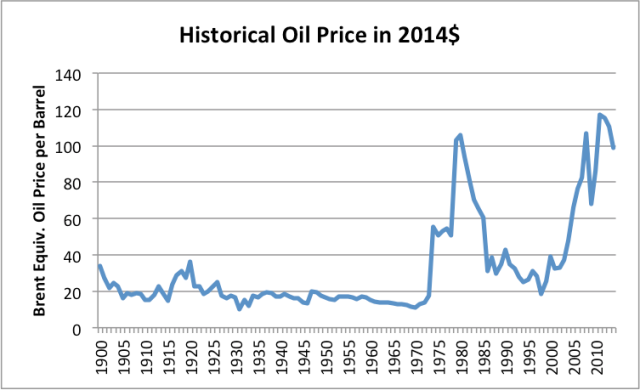
Figure 3. Historical World Energy Price in 2014$, from BP Statistical Review of World History 2015.
Figure 3 shows world oil prices. Given Insights (1) and (2), we would expect the rate of economic growth to slow during the 1975-1985 period and during the 2005-2015 period, and indeed they do, in Figure 1.
Insight 6. Increasing debt seems to be a major driver of demand growth, and thus energy consumption.
There are many reasons why we would expect debt to be hugely beneficial to economic growth:
Debt is used to “smooth” many kinds of transactions. For example, the payment of wages to an individual represents a kind of debt, since otherwise, the employer would need to pay the worker daily, using the type of goods produced by the business–something that would be very inconvenient.
Debt is also helpful in enabling big financial transactions, such as the purchase of a house or a factory or a car. With debt, the amount that needs to be saved up in advance is greatly reduced. Most of the cost can be paid in monthly installments over the life of the item purchased. If debt is used to pay for a factory, the output of the factory can be used to repay the debt.
An indirect impact of adding debt is that it helps raise the price of commodities, such as oil, steel, and electricity. This happens because with the use of debt, “demand” for expensive products like homes, factories, and cars is greater, because more people and businesses can afford to buy them, thanks to the availability of debt. These expensive products are made with commodities like steel, wood, oil, and coal. With more debt, the prices of these commodities tend to balance at a higher level than they would otherwise. For example, oil prices may balance at $100 per barrel, instead of $70 per barrel. At these higher price levels, production from higher-cost sources becomes profitable–for example, oil from deeper wells, water from desalination, and coal transported over longer distances.
Because of these benefits of debt use, it is hard for me to imagine that fossil fuel extraction could have occurred without the use of very large amounts of debt. I first discussed this issue in Why Malthus Got His Forecast Wrong.
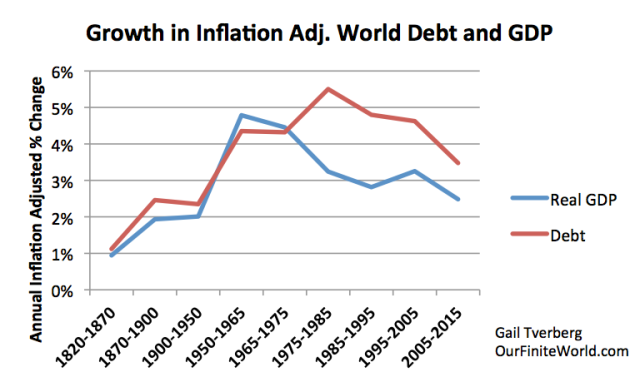
Figure 4 shows an estimate of how world debt has grown, on an annual, inflation-adjusted basis, compared to inflation-adjusted GDP. (See the Appendix for additional information.)
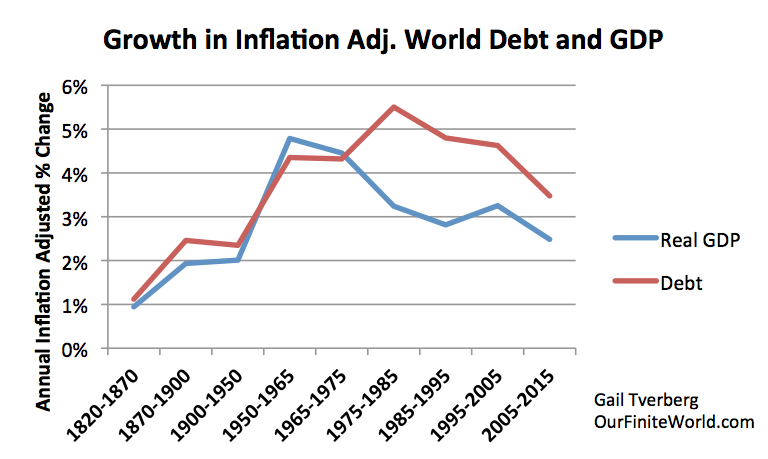
Figure 4. Worldwide average inflation-adjusted annual growth rates in debt and GDP, for selected time periods. See Appendix for information regarding calculation.
Figure 4 indicates that the growth of debt spurted about 1950. One influence may have been John Maynard Keynes’ book, The General Theory of Employment, Interest and Money, written in 1936. This book advocated the use of additional debt to stimulate economies that were growing at below their full potential. We also know that governments with war debts needed to offset the repayment of these war debts with new “peace debts” (debt available to businesses and consumers) if they didn’t want their economies to shrink for lack of debt growth. See my post The United States’ 65-Year Debt Bubble.
Insight 7. Once inflation-adjusted oil prices passed $20 per barrel, a change took place. We started needing much more debt to generate a dollar of GDP.
This problem can be seen on Figure 4–the lines diverge, starting in the 1975-1985 period. Up until about 1975, the rise in debt levels was similar to GDP growth. In fact, if we look at Figure 1, energy growth also tended to grow with debt and GDP in the pre-1975 time period. After 1975, we started needing increasing amounts of debt to generate GDP growth.
We can understand the need for more debt by thinking about how leveraging really works. Leveraging works because of the energy content of the supplemental energy. To get the desired quantity of energy content, a larger dollar amount of investment is needed to produce the same quantity of energy, if the cost of producing the energy product is higher.
Most people look at debt growth as a percentage of GDP growth, but this misses an important dynamic: is our problem occurring because debt growth is high, or because GDP growth in response to the debt growth is low? When I look at Figure 4, my conclusion is that when energy costs were low–basically at pre-1975 levels of $20 a barrel for oil, and similarly cheap levels for nuclear and other fossil fuels–it was possible for debt growth to approximately match GDP growth. Once energy costs started to rise, more debt was needed. Some of this was additional debt related directly to the process of creating energy products; some of this debt related to international trade and to buyers’ need to finance higher-cost end products.
Based on Figure 4, even the drop back to the $30 to $40 per barrel range in the 1985 to 2000 period didn’t fix the rising debt to GDP ratio problem. To truly fix the situation, we need to get the cost of producing fuels to a low enough level that they can profitably be sold at the equivalent of less than $20 per barrel. With diminishing returns, this seems to be impossible.
Insight 8. Adding more energy efficiency may require more debt growth as well.
The biggest spurt of debt came in the 1975-1985 period. If we compare Figure 4 to Figure 1, and consider what was happening at that time, quite a bit of this additional debt may have related to changes associated with increased energy efficiency: new efficient nuclear electricity generation to replace generation of oil with electricity; new more efficient home heating to replace old oil based heating units; and the building of new, more fuel-efficient cars.
Insight 9. The limit we are reaching can be viewed as a debt limit.
If demand really comes from additional debt, then what we need to keep GDP growth high is debt that grows sufficiently rapidly. (An alternative way of keeping demand high would be through rising wages of non-elite workers. Unfortunately, these wages tend to be depressed by diminishing returns–a problem I wasn’t able to cover in this post. See my post, How Economic Growth Fails.)
Many people believe that energy demand can rise endlessly. It seems to me that this belief is very close to the belief that the ratio of debt to GDP can rise endlessly.
Insight 10. Our debt system is very close to a Ponzi Scheme.
A Ponzi Scheme is a fraudulent investment program in which the operator promises a high rate of return to investors. Instead of obtaining these returns from true profits, the operator funds payouts to existing investors using ever-rising amounts of new investment. Eventually the plan fails, from lack of new investment dollars.
Our economic growth situation is not fraudulent, but otherwise it has uncomfortable similarities to a Ponzi Scheme. Instead of adding new investors each year, our economy needs to increase its amount of debt each year, in order to continue to grow GDP. GDP would not grow on its own, without additional investment funded by debt. To make matters worse, the required amount of additional debt rises, as the cost of producing additional energy products rises.
According to McKinsey Global Institute, global debt amounted to 286% of GDP in mid-2014. It had been “only” 246% of GDP in 2000. A person can see from Figure 4 that even with this rate of debt growth, both energy growth and GDP growth have been slowing in recent time periods. The answer would seem to be to add more debt growth. Unfortunately, adding more debt puts us in a position where debt repayments becomes too high relative to ongoing spending needs.
It is this debt problem that leads to my concern that we are headed for a near-term financial system crash. Even purposely slowing debt growth tends to make the economy slow, and thus lead to a crash. Because of the Ponzi nature of our arrangement, any kind of slowing of debt growth is likely to lead to a debt crash. There are several reasons to support this contention:
- With lower debt, commodity prices are likely to stay low, or fall further. Our economy’s long-term tendency toward inflation will shift toward deflation, making all existing debt harder to repay.
- Without a rapid rise in debt, the price of oil and other commodities will tend to stay low, leading to huge defaults in these sectors.
- Once debt defaults start, lenders are likely to require higher interest rates to compensate for rising level of defaults.
Appendix
Background on Long Term World GDP, Energy, and Debt Indications
Economic theories have grown up over roughly 200 years without the benefit of information regarding the relationship between economic growth, debt, and the use of energy products, on an aggregate basis. Long-term data are mostly compiled on an individual country basis. Many countries are missing from standard listings, especially for recent years and for distant past years, making unadjusted summations of the amounts shown misleading. Fluctuations in currency levels add to the confusion.
Because of these issues, it is quite possible for economists to develop theories, but never have good aggregate data to test them against. Aggregate data are very important to me, because we now live in a globalized world. It is hard to make sense of the world economy if the group of oil exporting nations shows one pattern, the group of newly industrialized countries shows another pattern, and the US, Europe, and Japan show a third pattern. Analyses limited to a handful of countries “like us” can provide very distorted indications.
Fortunately, there are some data sources that permit aggregation of data for the world as a whole. In particular, the USDA Economic Research Service conveniently “fills in the blanks” with reasonable estimates of GDP, making it possible to sum indications to a world total, at least for 1969 and subsequent. Another source of world GDP data is the “Maddison Project,” started by Angus Maddison and now updated by Bolt and van Zanden. Long-term world energy data are also available from BP for 1965 and subsequent years, and from Smil, for the years 1820 to 2008, but there are data differences that need to be bridged to combine them.
Figure 1A is a repeat of Figure 1 above, showing the long-term trend in world GDP, broken down between growth in energy use and other changes, primarily related to improvement in technology and greater efficiency.
Figure 1A. World GDP growth compared to world energy consumption growth for selected time periods since 1820. World real GDP trends for 1975 to present are based on USDA real GDP data in 2010$ for 1975 and subsequent. (Estimated by author for 2015.) GDP estimates for prior to 1975 are based on Maddison project updates as of 2013. Growth in the use of energy products is based on a combination of data from Appendix A data from Vaclav Smil’s Energy Transitions: History, Requirements and Prospects together with BP Statistical Review of World Energy 2015 for 1965 and subsequent.
Based on Figure 1A, growth of energy consumption ranged from 52% to 89% of GDP growth. Over the period 1965 to present, growth in energy consumption averaged 68% of GDP. Some academic research gives a similar result. Gael Geraud, who analyzes the results for 50 countries between 1970 and 2011, says that in the timeframe he studied, “The long-run output elasticity evolved between 60% and 70%.” Geraud’s results contrast with an economic theory that says that energy is only responsible for a share of economic growth proportional to its cost as a percentage of GDP–typically something like 8%.
If we look at the Efficiency/Technology piece separately, the only times it contributed more than 1% per year to economic growth were during the 1975-1985 and 1985-1995 timeframes, when GDP growth exceeded energy growth by 1.4% and 1.3% respectively. This was the time when major changes to the economy were being made in response to the price spikes of the 1970s. As indicated in Figure 4A, this was also the time when increases in debt were very high relative to GDP growth, suggesting that very high debt growth is needed to produce these higher efficiency gains.
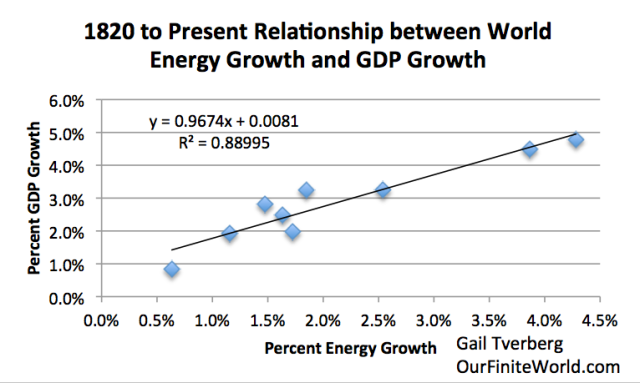
Figure 2A shows another way of looking at the same data as in Figure 1A. The slope of the fitted line is .97, indicating that energy consumption and GDP have tended to grow at almost the same rate over the long term.

Figure 2A. Data in Figure 1, displayed in X-Y chart format.
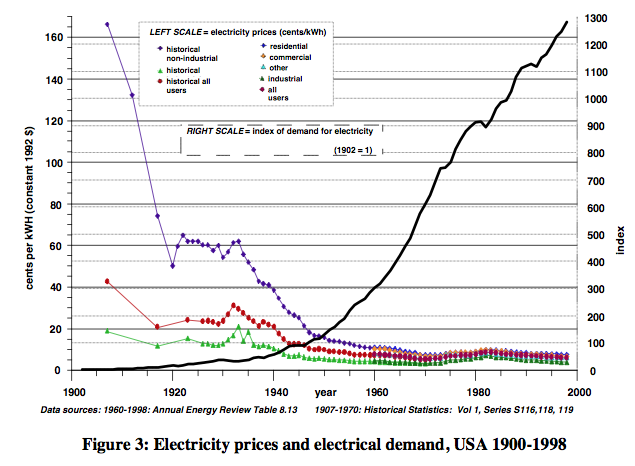
Of course, the extraction of energy products is enabled by technology growth. Consumers want the use of end products (like refrigerators and cars), not the use of the fuel itself. Increased energy efficiency also enables growth in energy use, because it makes products cheaper for buyers, enabling economic growth. For example, Figure 3A shows the rapid growth in electricity usage in the 1900 to 1998 time period, as US electricity prices fell.

Figure 3A. Ayres and Warr Electricity Prices and Electricity Demand, from “Accounting for growth: the role of physical work.”
Another thing besides technology and energy efficiency that enables the extraction of fossil fuels is growth in debt. Here again, there is a problem with inadequate data, on a long-term worldwide basis. We have some information about recent global debt ratios to GDP based on a McKinsey study. In addition, Bawerk provides a graph showing a long-term rise in the ratio of US total credit market debt to GDP. Longer-term debt patterns related to USFederal debt by itself are also available. One thing that becomes clear is that there has been a strong upward trend in debt levels, relative to GDP, for the US and for the world, for a very long period.
If we use worldwide data to the extent it is available, and substitute US total debt ratios on early periods, it is possible to make a reasonable approximation as to how this growth in debt must have taken place. To correct for inflation, I have applied these debt to GDP ratios to the inflation-adjusted GDP amounts underlying Figure 1A. Once we have debt amounts on an inflation-adjusted basis, it is possible to calculate average annual growth rates in this inflation-adjusted debt. This is what I show in Figure 4A.
Figure 4A. Worldwide average inflation-adjusted annual growth rates in debt and GDP, for selected time periods.
Since 1975, energy has gradually been changing to require much more debt per unit of energy produced, for three reasons:
- The overall cost of production of these energy products rose starting in the mid-1970s. As a result, debt went “less far” when it came to producing additional barrels of oil or kilowatt-hours of electricity.
- The nature of energy production began shifting toward greater use of front-end investment compared to ongoing expense. This change led to a need for more debt, because front-end investment tends to be financed by debt, while ongoing expense does not. Examples requiring heavy front-end investment include oil sands, oil from shale, deep-sea oil projects, wind turbines, and solar PV.
- If investment costs are low, oil and gas companies can often use profits from prior projects to finance new projects, so there is no real need for borrowing. When profits are squeezed by rapidly rising extraction costs, as has been the case in recent years, oil companies begin to borrow to pay ordinary expenses, such as paying dividends. They are so cash-strapped that almost any expense needs to be accomplished using debt.
The rest of the economy has also experienced a greater need for debt as energy prices rise. For example, oil imported at a high price requires much more debt than oil imported at a low price. A house built using expensive oil and other energy products is more expensive to purchase, and so requires a higher mortgage. When automobiles are made to be more fuel efficient, this tends to raise their cost and thus, the amount of debt required by those purchasing those automobiles.
It is clear that this increase in debt ratios cannot continue endlessly, for reasons discussed in the main text. Perhaps those evaluating alternative energy sources should be computing estimated “energy return on debt investment” ratios for these new sources. The ideal new energy source will be very close to self-funding, with little build-up of debt.


Comments
Post a Comment